...
ePurpose
This report compares the highest and lowest performance on each question. It selects the upper 27% and lower 27% of students who have selected each option in a question. (The percentage can be overridden in the cohort dropdown on the previous screen). A question's difficulty p is calculated as (average score)/(maximum achievable score). It ranges from 0.0 (nobody got it right) to 1.0 (everybody got it right). Values of p<0.25 or p>0.75 indicated questions with limited differentiating power.
...
It then lists each question as they appear in the report headed by theme:

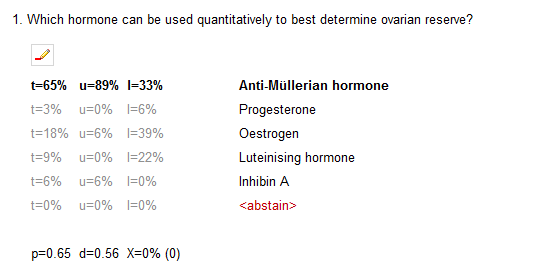
In this case, d is low for this question and so is not testing in the same way that the exam is. The examiner can choose to exclude the question by clicking the red pencil icon.
...