...
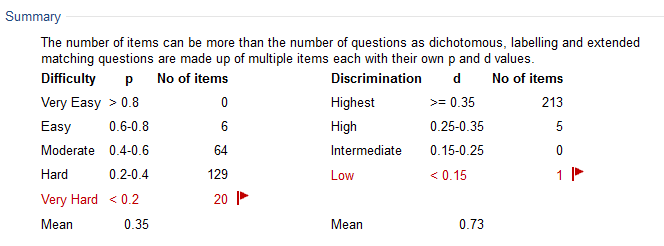
This report compares the highest and lowest performance on each question. It selects the upper 27% and lower 27% of students who have selected each option in a question. (The percentage can be overridden in the cohort dropdown on the previous screen). A question's difficulty p is calculated as (average score)/(maximum achievable score). It ranges from 0.0 (nobody got it right) to 1.0 (everybody got it right). Values of p<0.25 or p>0.75 indicated questions with limited differentiating power.
...
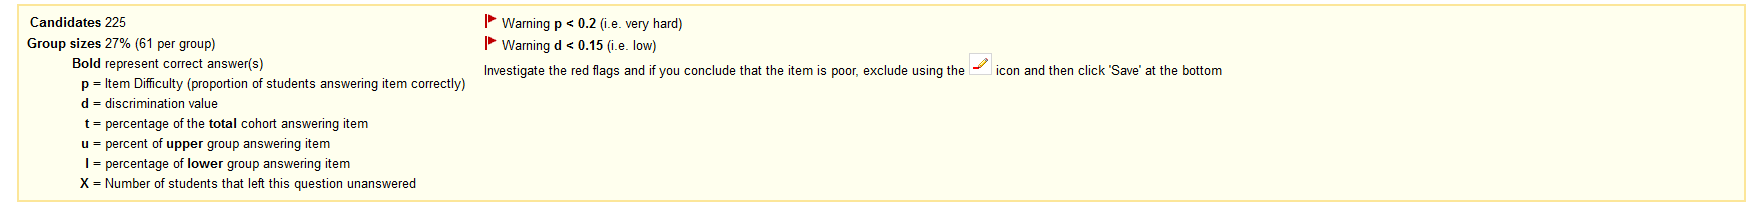
Each report has a header section that lists basic statistics:
It then lists each question as they appear in the report headed by theme:
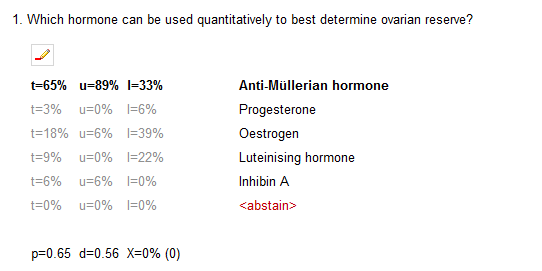
In this case, d is low for this question and so is not testing in the same way that the exam is. The examiner can choose to exclude the question by clicking the red pencil icon.
The two letter codes against an orange background indicate An orange rectangle indicates that standard setting is being applied to the question.
...
The icon  allows examiners to toggle the specific question's inclusion in the papepaper. Questions are included by default
...
Lists the overall F&D statistics for the paper.
The Save button persists any question exclusions back to the system.